Driving business performance through KPI dashboards
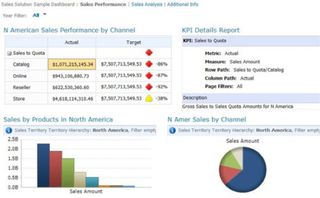
Effective KPI dashboards can help you keep track of your targets and how you're measuring up to them.

Effective data analysis is now at the core of most successful businesses. Whether produced externally or internally, those companies that can draw value from the rafts of information available to them are often the ones that end up ahead of the competition.
Where systems and data are disparate and siloed, it's difficult to measure key performance indicators (KPIs), especially where multiple applications are used by different departments. Just taking the data from those applications to feed separate reports can be onerous, not to mention the problems associated with cloned data.
Centralisation and automation, with powerful analysis tools layered on top, can provide the solution to these KPI woes, producing polished dashboards and rich reports that can be shared easily across an organisation.
Slicker visualisations with Excel
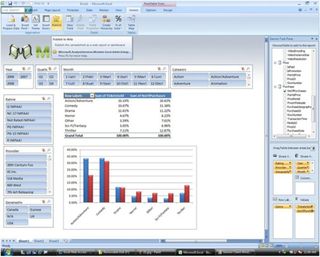
Often, the solution is right under a business' nose. Microsoft Excel, which remains at the heart of many organisations' business intelligence strategies, is a solid platform on which to base slicker visualisations and dashboards that present KPIs in easy-to-understand formats.
It is possible to either import some pre-defined templates for Excel, or you can easily create your own; inputting data and building the right formulas, and then creating dashboards around that with tools such as Pivot tables. When all this is plugged into SharePoint, an Excel-based dashboard opens up, enabling anyone to be kept up to date.
Importing and analysing data from other services is now easier too, with services like PowerPivot and Power View able to make sense of various kinds of information streams. Like any tool, Excel has its limitations, but the application continues to improve and expand.
Get the ITPro. daily newsletter
Receive our latest news, industry updates, featured resources and more. Sign up today to receive our FREE report on AI cyber crime & security - newly updated for 2024.
"There are solutions on the market that aim to address these limitations not least by Microsoft, whose PowerPivot feature in conjunction with SQL Server and SharePoint uses an Excel front-end in-memory analysis component that allows users to analyse larger volumes of data on-the-fly," said Helena Schwenk, head of the analytics research programme at MWD advisors.

Top employment law firm Lewis Silkin opted to clean up its fragmented reporting strategy using Microsoft SQL Server 2012. Its Finance Systems team took four days every month to collate data from various applications to feed 20 different reports. Not only this, but the data was neither accurate nor consistent
To address the problem, Lewis Silkin consolidated data into a central repository, drawing information from SharePoint Server and Microsoft Office. SQL Server 2012 Analysis Services, as well as the software integration and reporting tools, let the firm run a single business intelligence solution with one true view of operations.
Monthly and quarterly reports on trends, projects and client billing were automated. Thanks to the centralised system, client reports could also be created in a matter of hours, rather than days. Meanwhile, colour-coded "fuel gauges" show whether staff are hitting or missing targets. All of this makes for a slicker, better performing law firm.
Richer reporting with CRM dashboards
For smaller organisations Excel can prove invaluable, letting them keep track of operations without having to worry about excessive costs. For larger businesses, Excel has a range of business intelligence tools like PowerPivot, that allow for quick data crunching on big data sets, while giving departments a simple KPI management setup that they can tinker with themselves.
Sales, marketing and customer service teams need software that immediately presents them with KPIs in an easy-to-understand format. For this, IT wants to provide an app that can handle a lot of data, while providing an attractive, intuitive GUI that allows workers operate it easily, without the need for any technical know-how. Customer relationship management (CRM) systems are now becoming the norm across many industries, providing easy-to-use front-end dashboards that let sales teams drill into data by simply clicking around, with automation doing much of the work.
Microsoft Dynamics CRM can draw in data from multiple parts of a business, from Sales to Marketing and Services, delivering reports in real-time. Microsoft Dynamics CRM delivers customer information in a unified store via the Microsoft cloud. It contains all the data visualisations that sales teams need to make quick decision in one place, eliminating the need for other customer-related apps. And IT only needs to do one configuration. It's simple, intuitive and easy to manage.
Major Austrian bank Volkskreditbank (VKB) AG has seen the benefits of deploying Dynamics CRM. It was able to deliver KPIs to product teams, marketers and executives for reporting and analysis, tracking the performance of specific products, and allowing them to drill down by branch, region, time period or customer demographics. It was granular yet simple KPI oversight.
PowerPivot for Excel and Microsoft Dynamics work seamlessly together, meaning VKB could move data between the two programs, opening up the business intelligence options.
For VKB Sales teams, this reduced the time spent on drawing up KPI dashboards and scorecards, meaning they could expend more effort selling and building relationships with customers. In just one year, the average number of customers that each salesperson served shot up 32 per cent. It also reported time savings on report generation of 95 per cent and an 18 per cent improvement in customer service standard, meaning quality was not being sacrificed for quantity.
Performance management and operational effectiveness
You have your teams using Excel for operational performance monitoring, and you have your sales teams running shiny CRM solutions to check they are hitting those ever-important targets. But there are other avenues, if those tools are not quite right.
"One possible alternative to enterprise KPI monitoring/dashboard solution is a performance management application designed to provide business managers with means of measuring performance against organisational goals in order to ensure continuous improvement and operational effectiveness," Schwenk added.
"They typically work by continuously monitoring and measuring strategic goals (or plans) formulated in the boardroom against their execution at the operational level, with key performance indicators distilled into BI-driven metrics being the technological key."
Ideally, such a solution would be based on HTML so it can be easily shared and accessed across devices.
Fresenius Medical Care, which serves those suffering from chronic kidney failure, moved from using an SAP Business Information Warehouse feeding Microsoft Excel spreadsheets for its reporting to using PerformancePoint Services 2013, a component of SharePoint 2013 that comes with a Dashboard Designer.

The organisation based this on SQL Server 2012 Reporting Services (SSRS), while running SQL Server 2008 R2 Integration Services (SSIS) for extracting and transforming data, and SQL Server 2008 R2 Analysis Services (SSAS) for predictive analysis and data exploration.
With all this it was able to provide dynamic data visualisations to executives. As PerformancePoint is built on high-level languages - HTML5 and JavaScript - dashboards appeared the same no matter what machine or browser the user employed. That cross-compatibility is vital for department heads who don't want IT getting in the way of business.
With automated data conversion, company reports contained relevant, up-to-date information, and SharePoint made it simple for Fresenius employees to share, collaborate and draw up reports. This has all helped in making important business decisions, which, ultimately, can change lives for those suffering from kidney problems
Building a more intelligent business
Whatever a business does, whether that's making life better for those with serious illness, managing people's funds, or helping organisations with employee rights, workers need reports that display relevant, consistent KPI data so they can save time and make truly informed choices.
Fresenius, Lewis Silkin and VKB all chose Microsoft technology to provide the backbone for their KPI management and all saw major benefits, from cross-compatible software and interactive, up-to-date data visualisations, to better employee performance monitoring.
Those same tools are available for any organisation that wants to greatly improve their own in-house business intelligence operations.
Tom Brewster is currently an associate editor at Forbes and an award-winning journalist who covers cyber security, surveillance, and privacy. Starting his career at ITPro as a staff writer and working up to a senior staff writer role, Tom has been covering the tech industry for more than ten years and is considered one of the leading journalists in his specialism.
He is a proud alum of the University of Sheffield where he secured an undergraduate degree in English Literature before undertaking a certification from General Assembly in web development.


